[Back to Home Page]
www.RomanBlack.com
Hardware RNG v1
Pure random data generated from the chaos in the AC mains
Roman Black - 15th-28th Aug 2012
What is it?
This is a simple device based on a cheap PIC 16F628A microcontroller
that produces real-world random bytes, and outputs the random bytes
on a serial port connector so they can be recorded on any PC.
The real-world random data can be used for seeding encryption systems
or making passwords, or for generating math patterns, or any time you need
"real" RNG entropy rather than psuedo-random data.
Why a hardware RNG?
Math and scramble based software RNGs (usually called Psuedo-RNGs or PRNGs)
generally make data which progresses in a specific pattern.
Because of this it is
possible the pattern may be predicted by comparing with other examples,
although with good examples of PRNGs this can be very hard to do.
A hardware RNG (if working properly) generates random data that will be
completely new and unknown with any new bit or byte that is generated.
This is always beyond being predicted.
Generally software PRNGs produce a better quality of data which is "smoother"
and over longer periods of time will make a better spread of data that
has a more equal representation of every possible bit and byte combination.
A hardware RNG makes "rougher" data that (just like the real world)
may have trends where the data may be biased one way for a while, then
biased another way for a while (although with enough time the real RNG
data will approach statistical perfection).
Which type of RNG is better for the job is based on what you need the
data for. In many cases the best result will be to use the real randomness
of hardware RNG data to seed or hash with the statistically better data
of a PRNG. This gives the potential for a random data generator that has
the better statistical bias of the PRNG but with the impossibility of
prediction of a hardware RNG.
As I already have a good software PRNG
(see the Black RNG,)
my interest in hardware RNGs is to generate seed values and hash tables
to use in PRNG experimentation.
Other hardware RNGs
There are a few small Serial and USB based hardware RNGs available,
generally these use avalanche (breakdown) noise of a semiconductor
junction, which is then amplified and turned into 0 and 1 bits to make
the random data.
Using diode junction noise to create random data is not perfect.
It is generally accepted the data becomes worse over time due to physical
changes in the silicon. Also, there is a possibility the amplifier
and other components can cause nearby RF and magnetic fields to swamp
the extremely small signal from the avalanche noise.
The worst point is that the
total of the noise process combined with "whitening" process (removing
any 0 or 1 bit bias) will usually produce an output even if some part
of the system is faulty or swamped by other factors.
That means the device will appear to be producing good RNG data when
it is really producing bad RNG data. This symptom is called "break"
as in; "The RNG is broken, but we might not know".
High-end commercial hardware RNGs get around this by producing the
data in sets, and running that data
through complex testing before outputting the data. And this is another
problem with high-end hardware RNGs; high complexity and price.
Here are a couple of interesting and simply written pages on Hardware
RNGs and CD data compilations generated from hardware RNGs;
http://www.robertnz.net/true_rng.html
http://www.robertnz.net/hwrng.html
HardwareRNG1 makes data from the AC mains
This is my first design for a very simple hardware design that produces
very high quality real-world data that should have a good resistance to the
problem of "break".
Firstly, this RNG is SLOW. If produces 100 or 120 bits per second,
which is 12.5 bytes or 15 bytes per second, depending on if your
AC mains frequency is 50Hz or 60Hz. Hopefully this is not a problem
for small to medium data sizes as you can leave your PC logging RNG data
for as long as it takes to get the data you need.
Unlike most hardware RNGs that measure a high frequency noise amplitude
and convert it to bits with a comparator or ADC converter, this hardware
RNG uses a fast running counter at 5MHz, to capture the exact point in
time when the mains half-cycle occurs. So this is a noise:time based RNG
rather than a noise:amplitude based RNG.
With 50Hz mains there are 100 half-cycles per second, ie 100Hz. With a
5MHz counter each half-cycle takes 50000 counts, so as you can see
even a very tiny difference in the shape and timing of any mains half-cycle
will cause many counts difference in the captured counter value;
Actual recorded deviation in the 50000 count period of AC mains half-cycles;
   8
- 83
  63
-119
  68
-121
  58
-118
  56
- 88
  45
-111
  23
- 63
-  4
- 57
  12
- 54
   6
- 82
  40
-108
  62
-107
  50
- 68
You can see there is roughly +/-100 counts difference in the period
between each capture. In terms of real-world entropy this means there are
maybe 20 to 50 counts of good entropy in every capture. There is also an
obvious difference between each half-cycle in the full mains cycle, caused
by the AC mains sinewave being slightly asymmetrical (second harmonic
distortion). For the RNG project this will not matter as we only use the
LSB data which is only a fraction of the whole capture entropy.
Source of the AC mains entropy
The shape of the AC mains waveform is affected by everything connected
to the mains, and by the multiple power stations feeding power into
the mains. This relationship is almost infinitely chaotic and causes
a "chaos" element in the timing and shape of every mains cycle waveform.
Besides being adequately chaotic, this mains shape is of a high power
and low source impedance so it is not easily "swamped" by a small local
effect like in the way a tiny noise signal might be swamped.
If a small external RF or magnetic field is applied it will add to
the chaos but not remove it or swamp it, as chaos+pattern still
equals chaos. This means a
high frequency counter gated by the chaotic edge of the AC mains
frequency is quite hard to "break" compared to the very tiny and
delicate noise signal from a semiconductor junction.
Another factor that makes the hardware RNG resistant to the issue of
break is that the mains also has a regular component as well as a chaos
component. This regular component is the mains frequency which remains
relatively constant, at approx 50Hz or 60Hz.
In this hardware RNG the mains frequency is measured by capturing
the period of each half-cycle, and if that period is +/-4% out of
bounds then that mains cycle is discarded and no RNG output is produced.
This also causes a restart so after a bad mains cycle, there must be X
good mains cycles before RNG data output is resumed.
The mains period capturing is also "debounced" using some timed HI
and LO periods to ensure a good sync to the mains cycle and if any
error exists this debouncing will also trigger a mains error and restart.
To summarise; good entropy is always available to be captured because
of real-world chaos contained in every mains cycle, and the "regular"
frequency of the mains cycle is a convenient proof that the device
is operating and not experiencing a break condition.
Last 3 (LSB) bits of 16bit capture, every mains half-cycle;
4441703441374033040326314265333365532742436115722437171425667072140
6654466175712415306235421604663313333413116572647324235754275507250
1166725737774061467513657257075617703023362666715770215500555061667
7112110126056375634425601410363771767515216114253505623142015361161
6666661607344267745604212443352131541534251073317020124273171415671
1464673271255143435256104756662152257061303622404234000530717723012
4251401146626570352427425745631155206277277723200304711144252666253
4153642254400311747545553737541354237001634544613321447600510635334
5003465752343440357754161400604243132563574773761346751633237564106
Above shows mains half-cycle captures, where only the last 3 bits
of the 8bit counter have been kept as they have the highest quality entropy.
The least significant bit (bit0) has the best quality entropy but
from testing larger samples I found that all 3 of these bits have excellent
entropy quality.
How the hardware works
The 50Hz AC mains is received from a 12v AC plugpack (small transformer),
for safety, and because a transformer smooths out HF local noise but
keeps the low impedance LF mains chaos. This is converted to full-rectified
100Hz half-cycles by a small bridge rectifier (or 4 small diodes ie 1N4148).
A trimpot and 220 ohm resistor reduce this waveform to a 0-5v waveform
suitable to connect to a PIC comparator input pin. The PIC internal
comparator is set to a 1.04v threshold via the PIC internal Vref module.
The comparator output is connected to the PIC timer1 CCP1 module.
This causes a gating effect where the PIC 5MHz timer is gated on
every / edge of the mains waveform.
The PIC internal serial USART sends serial bytes back to the PC at
9600 baud, using a crude but functional transistor inverter. This is
cheaper and simpler than a MAX232 chip but you could use a dedicated
serial inverter chip if you prefer. In 95% of cases it is not needed.
Note! Some people may prefer to use a TTL-USB converter module instead
of the transistor and use USB comms instead of RS232 comms.
That's it! It doesn't need much more than a PIC and a few small
external components.
How the software algorithm works
After building the hardware I tested a couple of 100kbyte samples using
just the captured counter single bit, bit0 (the LSB). This produced excellent
entropy but seemed to have a very small bit bias where the 1 bit occurred
about 0.1% more often than the 0 bit. (With hindsight this tiny bit bias was
probably due to my first tests having small sample size, but it did not hurt
to address this as a potential issue anyway).
I addressed this bias by feeding the other two bits from the 3 bits known to
have good entropy (bit1 and bit2) into two shift registers, and then after
47 and 29 mains cycles respectively these old bit1 and bit2 were XOR hashed
with the new bit0;
The result of this was very good entropy (due to XORing unrelated bits from
different points in time, ie different mains cycles) and a very low possibility
of bit bias (due to the general effect of XORing 3 random bits together).
Hardware construction
Because the circuit only has a handful of parts it was very quick to
solder together just on a small piece of stripboard. You can make a PCB
if you like, but it is not necessary.
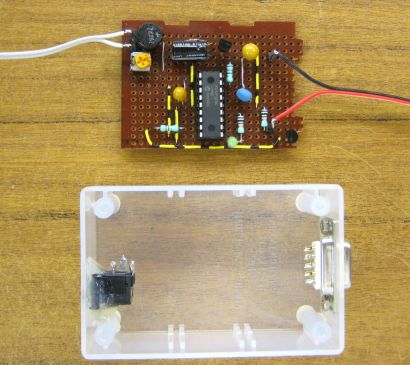
You can see the small round bridge recifier (top left) then trimpot to
adjust the waveform to 5v. PIC is in the middle, and the output NPN
transistor on the far right (any small type is ok, BC337, 2N2222 etc).
Capacitors used were tantalum and instead of a 20MHz xtal I used a 20MHz
resonator. A green LED flashes once per second to show "Data is good".
This board also has another diode, 78L05 5v regulator and electro cap
(up the top), these generate the 5v DC supply for the PIC from the actual
12v AC, while also measuring it. These are not shown on the schematic
diagram but you can work it out. :)
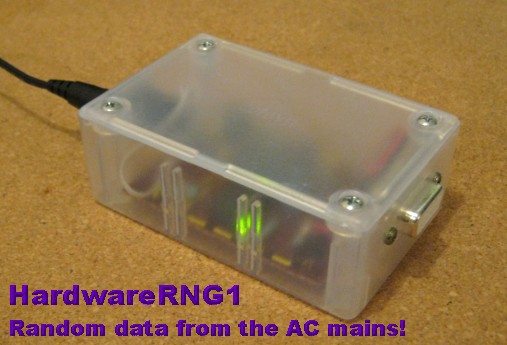
The case is a three dollar translucent zippy box 3" by 2". I added a
PSU jack socket for the 12v AC and a DE9 serial plug.
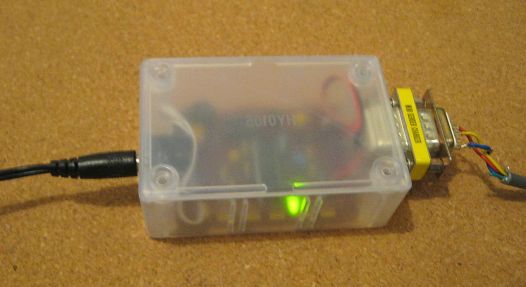
Nice and neat! AC 12v plugs in one side, and "perfectly random" data
bytes come out the other side.
Source code and HEX files
I have provided the source code for MikroC compiler and PIC 16F628A.
It is well commented and kept very simple so you should be able to
easily adapt it to other compilers or other PICs.
HardwareRNG1.c (9 kb).
These HEX files are ready to program into PIC 16F628A. You need the
correct one for your mains frequency!
HardwareRNG1_50.hex (2 kb).
HardwareRNG1_60.hex (2 kb).
Actual RNG data produced by this project
I ran the hardware RNG and produced three separate files.
(These are binary data files, each byte = 1 RNG byte);
test_binary3.dat (112 kb).
test_binary4.dat (131 kb).
test_binary5.dat (108 kb).
Being approx 100kb each these took around 2.5 hours each to make, as the RNG
only makes 12.5 bytes per second.
Bit bias in each file;
File;   bit0;     bit1;     %bias;
test3   459738    459262    -0.10%
test4   540264    541040    +0.14%
test5   443714    443558    -0.03%
There is no apparent bit bias, but because the samples are relatively small
at less than a million bits the real-world entropy produces some "trending"
as would be expected with smallish sample sizes.
Viewing the RNG data with custom software
I wrote some custom PC software to display the RNG data. The charts show
the frequency of each byte (0-255) and the freq of each bit in a byte
(both byte-aligned), and the freq of the 16 possible nibbles (nibble aligned).
In a good random file there should be roughly the same amount of each byte
0-255, although it might take megabytes of data for this to really level out.
The 3 files I generated look very typical of "good" random data, for their
file sizes of 108-130kb.
The red chart at the right is the "next byte correlation" and that means
for every byte it shows how often another byte appears directly after it.
If the random data was suspect then there would be a bias here where some
bytes always seem to follow others. Bytes are shown 255-0 across the X axis
(bottom) then the bytes after it are shown vertically. If the RNG data is
good then this should look even and without patterns, because randomly
there is a roughly equal chance of any byte following any other byte.
A white dot(s) in the chart show the byte pair that occurs the most,
which in the above chart is the byte 34 followed by 41, which occurs
10 times;
Worst cases serial byte correlation;
 'Perfect' next byte value = 1.753 times
  34,  41 = 10 times
  84, 106 = 9 times
 123,  65 = 9 times
 164,  25 = 9 times
 164,  70 = 9 times
 164, 191 = 9 times
 172, 250 = 9 times
 245,  97 = 9 times
   4, 122 = 8 times
Many other byte pairs occur at 9 times, 8 times etc which is quite
reasonable when there are 65536 possible byte pairs and this small
sample size. The important thing is that there are no pairs that
really stand out far above the "normal" popular pairs.
Results in test 4 are statistically similar (but s slightly larger test),
although the most popular byte pairs are different to test 3 because
the data really is random;
Worst cases serial byte correlation;
 'Perfect' next byte value = 2.062 times
 219, 130 = 11 times
  67, 172 = 10 times
 101, 141 = 10 times
 130,   1 = 10 times
 214, 204 = 10 times
   8,  32 = 9 times
   8, 174 = 9 times
  13, 194 = 9 times
Test 5 above has a few bytes pairs that all occur 9 times, so there
just happens to be more white dots but the data spread is as random
as the previous tests;
Worst cases serial byte correlation;
 'Perfect' next byte value = 1.692 times
 128,   7 = 9 times
 143, 232 = 9 times
   9, 234 = 9 times
  37, 176 = 9 times
  50, 101 = 9 times
  56,  57 = 9 times
  59,  23 = 9 times
Comparison displays showing "bad" RNG data

Above shows 1 million bytes of data generated by a simple fractal software
RNG;
x = (x * 51 / 47) +1
(where x is 32bit unsigned long, and only the least-significant byte is output)
The byte, bit and nibble frequencies are not too bad and this could even be used
a simple software RNG. However the next byte correlation is very flawed
and some byte pairs do not exist at all while others are far too popular;
Worst cases serial byte correlation;
 'Perfect' next byte value = 15.259 times
  80, 249 = 435 times
 176,  68 = 433 times
 244, 150 = 433 times
 234, 112 = 432 times
 100, 135 = 374 times
   3, 200 = 373 times
 120, 179 = 373 times
The most popular byte pairs are 28 times higher than the perfect value! With good
RNG data the popular byte pairs approach the perfect value and in a 1Mb file
should only be about double the perfect value at the worst.
Above shows a 322kb zip file. Zip compression produces a fair "random" result
but there are obvious problems with the nibble frequency and the byte pairs
show a clear leader of 0 followed by 0, and the frequency of byte 0 is also
obviously higher than the other bytes. Some of this is probably caused by
the zip header data. There is also a very visible lack of density in the
next byte correlation even though it shows good coverage.
Above is a 255kb gif file, with numerous patterns showing up especially on
64 and 32 bit boundaries.
Finally here is a 1.9Mb uncompressed bmp photo, for your viewing pleasure. :)
(I plan to release the entropy display software as freeware in the near
future, once I have refined its display features).
- end -
[Back to Home Page]