[Back to Home Page]
www.RomanBlack.com
1kHz precision sine generator using PIC
Using a 16F628 to generate an accurate 1kHz sine in software for calibration and test use
Roman Black - 16th Jun 2011, updated 26th June 2011.
Goal
This is a very simple circuit where the PIC and an internal 1kHz sinewave
table do all the hard work of making an accurate sinewave. Then it
needs only a few external parts for filtering.
The sinewave has a very high frequency accuracy as it is generated from
a xtal. And with appropriate filter parts the sinewave is quite low in
distortion. This makes the device useful for calibration testing and
any use where you need a mathematically correct sinewave of a very precise
fixed 1kHz frequency.
How it works
The PIC runs from a 20MHz xtal. The PIC generates one PWM cycle for
exactly 100 instructions, ie every 20uS.
The sinewave is generated by a 50 entry sinewave table for the complete
sine period of 50 * 20uS (1000uS).
The sine table was created in Excel spreadsheet and makes a sine ranging
from PWM 14 to PWM 86, a total PWM amplitude of 73% which is accurately
distributed around the mid voltage point of 50% PWM. The sinewave was
deliberately made at this amplitude to get the best performance out of the
PWM system.
The sinewave has some tiny error in each sample, but every sample
has been rounded up or down to
the closest PWM value to a perfect sine. The max error for any sample is
less than 0.68% of the sine amplitude. Hopefully this will not matter in
the final operation as the important thing is the overall shape of the
sinewave, because all the tiny PWM errors will be easily integrated out
by the hardware filter.
First hardware testing
A PIC 16F628 was set up with nothing more than a 5v regulator and 20MHz
xtal (and a few PSU caps etc).
A trimmer cap was used to trim the 20MHz xtal to better than
1 PPM against my GPS tuned frequency meter. This means the 1kHz output
will be 1000.000Hz (+/-0.001Hz).
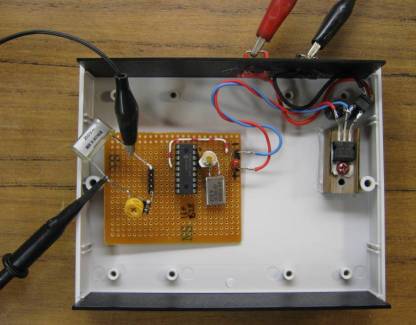
The PWM output from PIC pin RB3 was filtered through a 1k trimpot and
0.22uF cap. The trimpot was adjusted to about 800 ohms, and the output
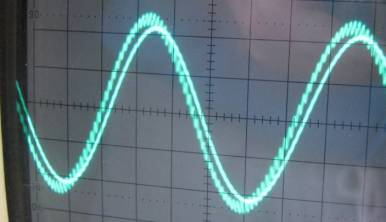
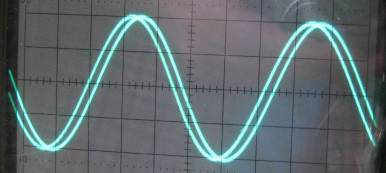
of the filter is shown below on the scope;
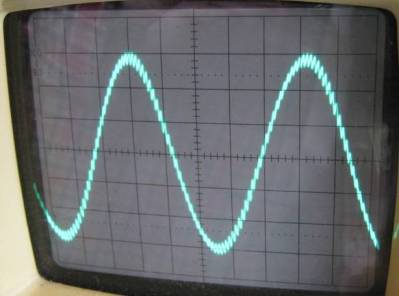
The sine wave is about 3v amplitude peak to peak. You can see the 50kHz
PWM frequency as the fine sawtooth "hash". But importantly, the overall
shape of the sine looks quite good and the tiny differences in each
of the sine table enries look to have already been smoothed out.
Simple RC filter test
Checking some online "low-pass filter calculators" showed that inductor
values would be quite large and these inductors might not be very accessible for a
simple hobby style build. So I fiddled with some RC values in an attempt to get
a good 2v p/p sinewave.
I tried to keep the first stage impedance low, but 330 ohms to 0.33uF was
about as low as I could go without causing some distortion from drawing
too much current from the PIC output pin. Then the other 2 stages tried to
keep total impedance low by keeping the resistor values low, and used
just enough capacitance to get rid of the 50kHz PWM hash while hopefully
having very little effect on the sine shape or amplitude.
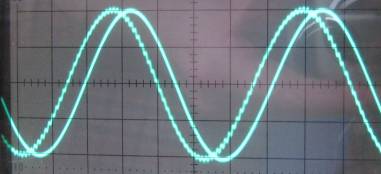
Above shows the waveforms at points A (2.4v p/p) and B (2.2v p/p).
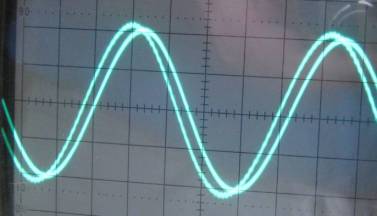
And here are the waveforms comparing point B with the final
output at point C (2.0v p/p). Afterward I zoomed the 'scope right
in but can't detect any 50kHz freq in the final output.
Output impedance was tested by using a variable resistor to load the
output to half amplitude, the output impedance is 951 ohms.
Unfortunately I don't have a distortion meter to measure just how good the
output sine wave is made by such a simple filter. But when I adjusted the
amplitudes on the 'scope to be the same, the 3 sine waveforms appear to
be exactly the same shape as each other, which is a good sign (good sine? haha).
Improved filter by adding one inductor
I don't have many inductors in the mH size range apart from some cheap
miniatures that are a bit nasty. However I did find some decent sized 1.15mH
toroids in my old stock. I added 2 in series (to make a 2.3mH inductor)
in the first filter stage.
This reduced the 50kHz hash at point A by about 60% compared to the same
filter without the inductor. Which was quite nice
and better still had practically no visible effect on the sine wave shape.
I did notice all the amplitudes went up a couple of percent I assume this is
because the currents out of the PIC pin are reduced due to the inductor
so the PIC output pin FETs are able to produce a few percent more average
voltage. As I saw previously reducing the current loading on the PIC output
improved the sine shape so this is a good thing.
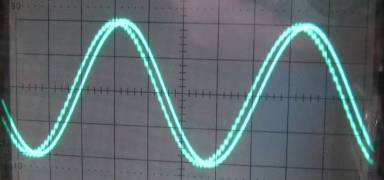
Above are the waveforms at points A and B. The 50kHz hash is greatly reduced.
I have normalised the amplitudes on the 'scope to compare the waves.
There is almost no hash visible at point B.
Above shows point B again and the final output at point C. Amplitudes have
been normalised again. The final output must be REALLY free of hash now.
Above shows point A compared to the final output point C. Since all 3 of these
waves have exactly the same shape I am guessing the sine distortion is pretty
low. :)
Finishing it off
Being happy with the performance of the sine generator (it has better freq
accuracy and sine distortion than my commercial sine generators) I decided
to add a little complexity like a calibrate switch and dual-colour LED to
show if it is in SINE or CAL modes;
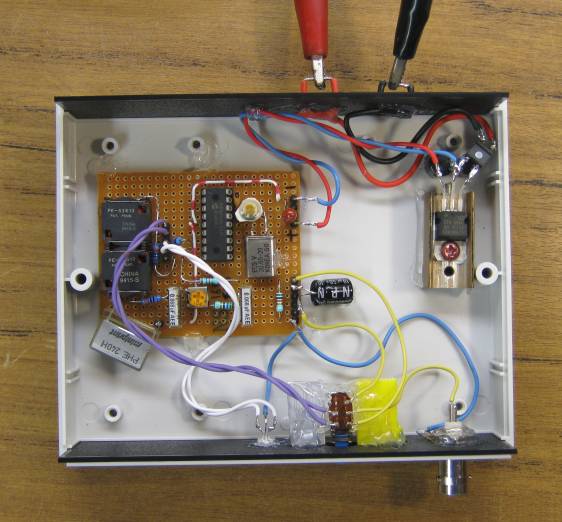
The two black square devices on the left are 1.15mH SMPS toroids left over
stocks from years ago. Together in series they make
2.3mH. The filter is 3 stages, values as shown in the diagram above but I
added a trimpot in the last stage to trim the 2v p/p output voltage.
A dual-colour RED/GREEN LED was used to add a nice touch, and is driven
automatically by two PIC pins. A DPDT push on/off switch was glued in place
with 2 support blocks and hot melt glue in "Borg Hive" style. The switch selects
SINE or CAL mode and in CAL mode it disconnects the filter and connects
a 1MHz output from the PIC to the device output.
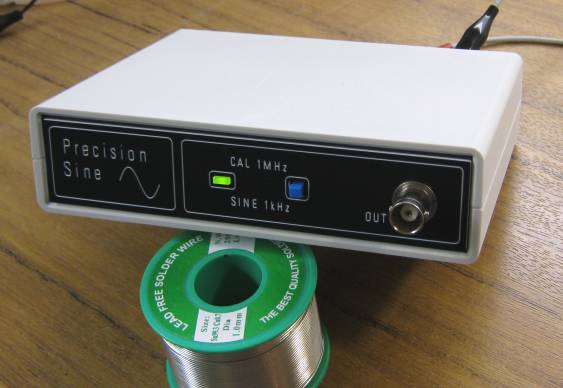
The finished device. I added an engraved front plate. You can get these made
for a few dollars at any "trophy engraving" shop. :)
Here is the full schematic. The DPDT switch pulls RB0 low in CAL mode, this tells
the PIC to output a 1MHz squarewave instead of the sine. At the same time the
DPDT switch disconnects the sine filter.
Download the C source code and HEX file; Sine1kHz.zip 9kb
Super-simple version
If you just want to throw together a 1kHz sine generator and don't need
the extra 1MHz calibration switch and LEDs etc, this is the
simplest setup that will just make the sinewave;
With nothing connected to PIC pin RB0 the software always defaults
to sine mode, so this simple version uses the same PIC software (see above).
The filter has been reduced to 2 stages for simplicity and common parts,
the values shown will remove all the 50kHz hash and give a very nice
quality sinewave output at about 1.5v p/p.
If you just use a 20MHz xtal and two 22pF caps, xtal frequency will be
within about 50 PPM accuracy, so the sine freq will be
1000.00Hz +/-0.05Hz. If you use a trimmer cap you can trim the xtal to a
higher accuracy using a frequency meter. Remember if you gound PIC pin
RB0 the PIC will output 1MHz from pin RB3 to allow calibration (you have to
measure at RB3 as the 1MHz will not get through the filter!).
Accuracy... And accuracy improvements!
Thanks to the expert help from some of the regulars at the Electro-tech online forum
(MrAl, TheElectrician, EricGibbs)
an early problem with the sine distortion was found and eliminated, see below.
New! 16th July 2011. I've been asked to take part in a pilot program on the
Electro-tech forum where some of my projects are linked to a thread
where you can;

2nd harmonic distortion!
My first sine table was generated with some effort to make all 50
entries properly rounded and to ensure the top and bottom half of the
sine were symmetrical.
However the PWM created by the PIC is "left-aligned, trailing edge" which
is a very standard PWM but this causes a 2nd harmonic distortion.
The distortion is caused because the PWM always has the HI period before
the LO period, and the left edge is fixed. So the average voltage of each
PWM pulse is fractionally shifted in time compared to the original
sine.
The result is that even though the original sine table had matching top
and bottom halves, after the PWM output and filtering the top and bottom
analog halves no longer match perfectly.
TheElectrician did a fourier analysis of the
original PWM pattern and diagnosed an error of 3% THD, of 2nd harmonic
distortion. My 3stage filter would reduce this to an estimated 1.5% THD.
He tested this with a hardware function generator and hardware THD
meter and got a real world result of 1.6% THD (almost all 2nd harmonic).
MrAl did a comprehensive math analysis of my original PWM values into
my exact RLC filter values and came up with a final THD after filter of
1.2% (almost all 2nd harmonic).
Suggestions were provided by TheElectrician and MrAl of using a centre-aligned
PWM or somehow inverting the second half of the PWM table and using PWM that
is right-edge aligned. Unfortunately the PIC PWM module cannot do these things
and it would require manually generated PWM in code.
Above is a simulation (provided by TheElectrician) showing what 2% error of
2nd harmonic distortion looks like. As my original sine generator would have
had 1.2% THD this small error was just not visible to me on the 'scope!
Fixing the 2nd harmonic error
I read some research papers on PWM being used to reproduce high-fidelity audio
waveforms and learned that the sine table could be generated by "natural
sampling" instead of the "regular sampling" that I used.
Natural sampling is a common method that occurs in some hardware PWM
encoders and sets the PWM width by the point where it matches a linear rising ramp;
Above you can see that for the same 2 areas of the sinewave a different
PWM width is generated due to natural sampling of the original waveform
(blue sine) against a linear (purple) ramp.
How to do the "natural sampling" in Excel
My original sine table in Excel was very easy, it just used the sine
table value as the PWM value.
This "natural sampled" compensated table was more difficult as each
PWM value had to be interpolated at some point between every two sine
samples and the interpolation point is determined by the interpolation
point.
I quickly realised that because of the low table
resolution (1% amplitude steps) I could use a math short cut and still
get a result much more accurate than the integer rounding so it would
be "good enough".
The interpolation between any 2 samples was determined by the average
% height of those 2 samples. This gave the "average" ramp value to an
accuracy good enough to determine the ramp intersect.
Example in sine table of 2 consecutive entries; A71% B75%
A = A + (((A+B)/2)/100) * (B-A))
A = 71 + (0.73) * (4)
A = 71 + 2.92
A = 73.92
A = 74 (after integer rounding up)
No more 2nd harmonic distortion!
Above you can see the new 50 entry "compensated" sine table I generated in Excel.
MrAl did a math analysis of the above table
entries and (after my 3 stage filter) the result came out as total
THD of 0.08% with practically zero 2nd harmonic distortion. This was a
huge improvement on my original table that gave 1.2% THD!
NOTE!! The PIC source code and hexfile (above) now uses the compensated
sine table for greatest accuracy.
Proof of natural sampled PWM from the simulator
EricGibbs used a circuit simulator software
to model the 50 step PWM using the "natural sampled" method, (although he used
a reference sine to generate the PWM and not my sine table). He did still output
through my chosen RLC filter values (click image below);
There are actually TWO sines there, the BLUE one made by the circuit is
underneath a perfect RED reference sine. As you can see it is a very good
match!
Improving the filter!
My RLC filter values were chosen for one real design goal, to get 2v
peak to peak output amplitude and still remove the 50kHz PWM hash.
And it was tight, there is not a lot of filtering squeezed in
there considering there are 3 filter stages!
Almost any change to this filter that is an increase of filtering
results in a better sine and reduced THD. However it also results in
reduced amplitude and/or reduced output power. For my use, the whole device
already has superb frequency and phase accuracy and good overall sine accuracy
(at 0.08% THD) so there was no need to go better.
MrAL suggested using a much larger inductor, a
23mH instead of my suggested 2.3mH (this may be hard to obtain or
more expensive). TheElectrician suggested an inductor as large as 82mH,
and that the filtering would be improved by using increased impedance in
the later filter stages (which would result in reduced output drive).
Other people suggested increased filtering with larger caps and/or resistors,
or the possible use of active filters or output amps.
I will leave my original filter values as "standard" for this project
because they meet the design goal of simplicity and are easily available
to hobbyists. And because they were modelled in the calculations and simulatons
shown above.
But if you are after a really low distortion sine then you should consider
using a more aggressive passive filter and/or an opamp to boost the sinewave output, or
using an active (opamp) filter. A Google search will return many
"1kHz low pass filter" schematics and filter design calculators so I will
not spend much time discussing them here.
Update 27th June 2011;
Regarding using the 3 stage filter without the inductor (just with RC);
TheElectrician said; "The attenuation at 50 kHz for the
filter with the 82 mH inductor is 78 times greater than the 3 stage filter
without any inductor." MrAl said; "I thought that you might also like to know
that your original filter with the inductor means a filtered THD of 0.085 percent,
but with the inductor shorted out the THD only rises to 0.096 percent, so that's
just a little less than one tenth of one percent without the inductor.
You may want to mention that for people who dont want to worry about finding an inductor."
TheElectrician said;"I added an 82 mH inductor and checked to see if the
non-linearity of the inductor added significant distortion. The inductor (the one
I used, anyway) added some detectable 2nd and 3rd harmonic distortion as seen at
the distortion analyzer residual output with a low distortion sine wave of 1 kHz
applied to the input of the filter. The two additional harmonics amounted to
about .1%. So, even with an inductor adding some distortion, it should be
possible to get well under 1% THD with a sine table that doesn't introduce 2nd harmonic."
MrAl said; "I have to wonder if the non linearity of the inductor might
actually introduce more distortion in real life than it takes away in theory.
This really should be looked into because it's a big waste if it doesnt help
or actually makes it worse, and we can not do that kind of analysis in theory
because we dont know the characteristics of the inductor."
My summary; It seems the inductor is very effective at reducing the 50kHz PWM
hash, although this is largely gone by the end of the 3stage RC filter anyway.
There does seem to be a possibility that the inductor may introduce its own
distortion to the sine, especially large mH inductors that are small in size.
If in doubt, especially if you have no test equipment to measure THD it may be
best just to leave the inductor out.
Testing capacitance using 1kHz sinewave
I used the 1kHz sine to test some caps. Because the sine has excellent frequency
and low distortion it can be used to measure capacitance by putting one
cap and one resistor in series and solving by Xc (capacitive reactance).
Two matching Fluke multimeters were used to measure AC millivolts, and
the 2 meters matched each other in back to back testing exactly to the
millivolt.
I adjusted the variable resistor until the cap and the resistor had matching
AC volts. The 2 meters were left in place so their capacitance and resistance
was matched. Swapping the two meters gave identical results.
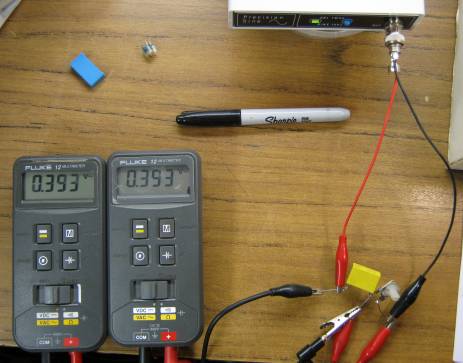
Above you can see the 0.22uF cap under test, both meters reading 393mV.
Then the sine generator was unclipped and the meter measured the value
of the variable resistor. I checked both meters measuring the one resistor
and both measured the same! Good old Fluke meters. :)
In this test the resistor measured 721 ohms, so the calc goes;
C(uF) = 1000000 / (2pi * f * Xc)
C = 1000000 / (2pi * 1000 * Xc)
C = 1000000 / (6283.18 * 721)
C = 1000000 / 4530172.7
C = 0.2207 uF
I also tested a 0.056uF cap and a 1000pF cap, resistances were 3.002k and
163.2k. Now I have 3 caps measured to a decent accuracy I can calibrate my
capacitance meter, and maybe build a new one. :)
Accuracy?
Well I know my sine freq is excellent as it was calibrated against my GPS
tuned freq meter. I assume my two Fluke meters measure ohms correctly as
they match each other to the last digit. I know they match AC millivolts
as they were tested by swapping. The main thing affecting accuracy is
digit rounding.
Millivolt matching was within 1 digit, so within about 0.3% or so. Ohms
likewise the last digit is about 0.2 or 0.3%. So capacitance accuracy is possibly
around 0.6% or better. I feel pretty confident that these 3 capacitors
can be called "1% capacitors" now.
- end -
[Back to Home Page]
